OEE — Overall Equipment Effectiveness
Real-time downtime capture Categorized causes Accurate timestamps
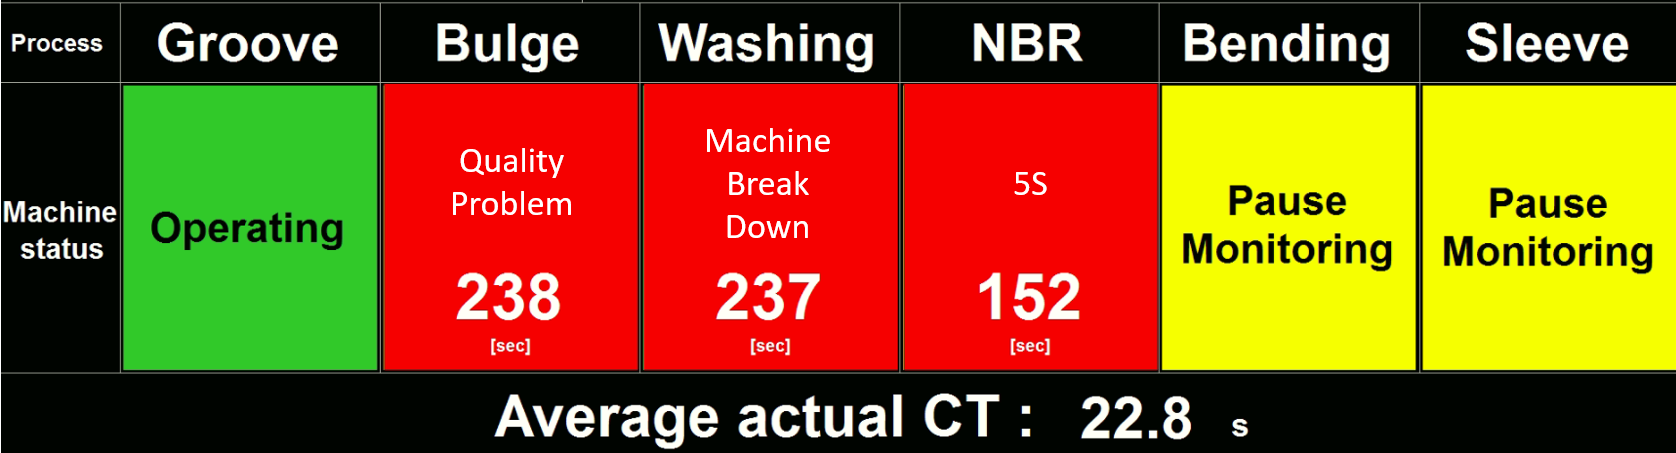
A dedicated software module to track, categorize, and timestamp every loss event on the production line—whether triggered automatically from PLC alarms or manually via scanner input. Supervisors get a live view with duration counters, reasons, and approvals, plus shift/day reports.
Key Features
Real-Time Event Capture
Start/stop timers instantly from PLC alarms or by scanning a loss code (barcode/QR).
Structured Categorization
Standard loss (Breakdown, Setup/Changeover, Quality, Material Wait, 5S, Minor Stops, etc.) with sub-causes and remarks.
Precise Timestamps & Durations
Automatic start/end time, running seconds counter, and calculated loss minutes per event.
Alerts & Thresholds
Notify via Microsoft Teams / email when a single event or cumulative loss exceeds limits.
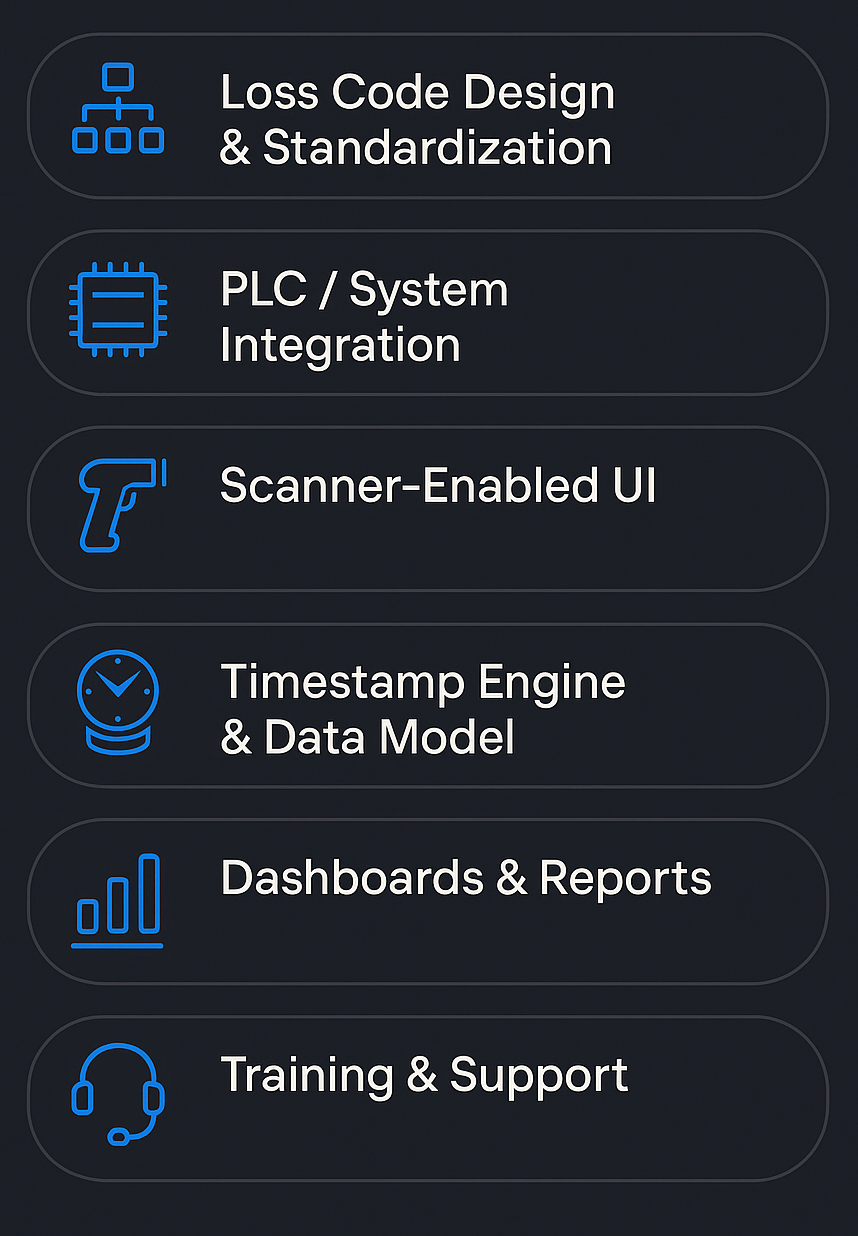
What We Do
Loss Code Design & Standardization – Build your cause tree
(main/sub causes, responsibility, recovery codes).
PLC / System Integration – Map alarm bits/codes from Siemens, Mitsubishi, Omron, Allen-Bradley
Scanner-Enabled UI – Fast entry of loss codes, minutes, remarks; operator ID via badge scan.
Timestamp Engine & Data Model – High-precision timekeeping (sec), overlap handling, and shift calendar logic.
Dashboards & Reports – Live timers, Pareto, MTBF/MTTR, line/machine trend; export Excel/PDF/CSV.
Training & Support – On-site commissioning, SOPs, and ongoing optimization.
System Workflow
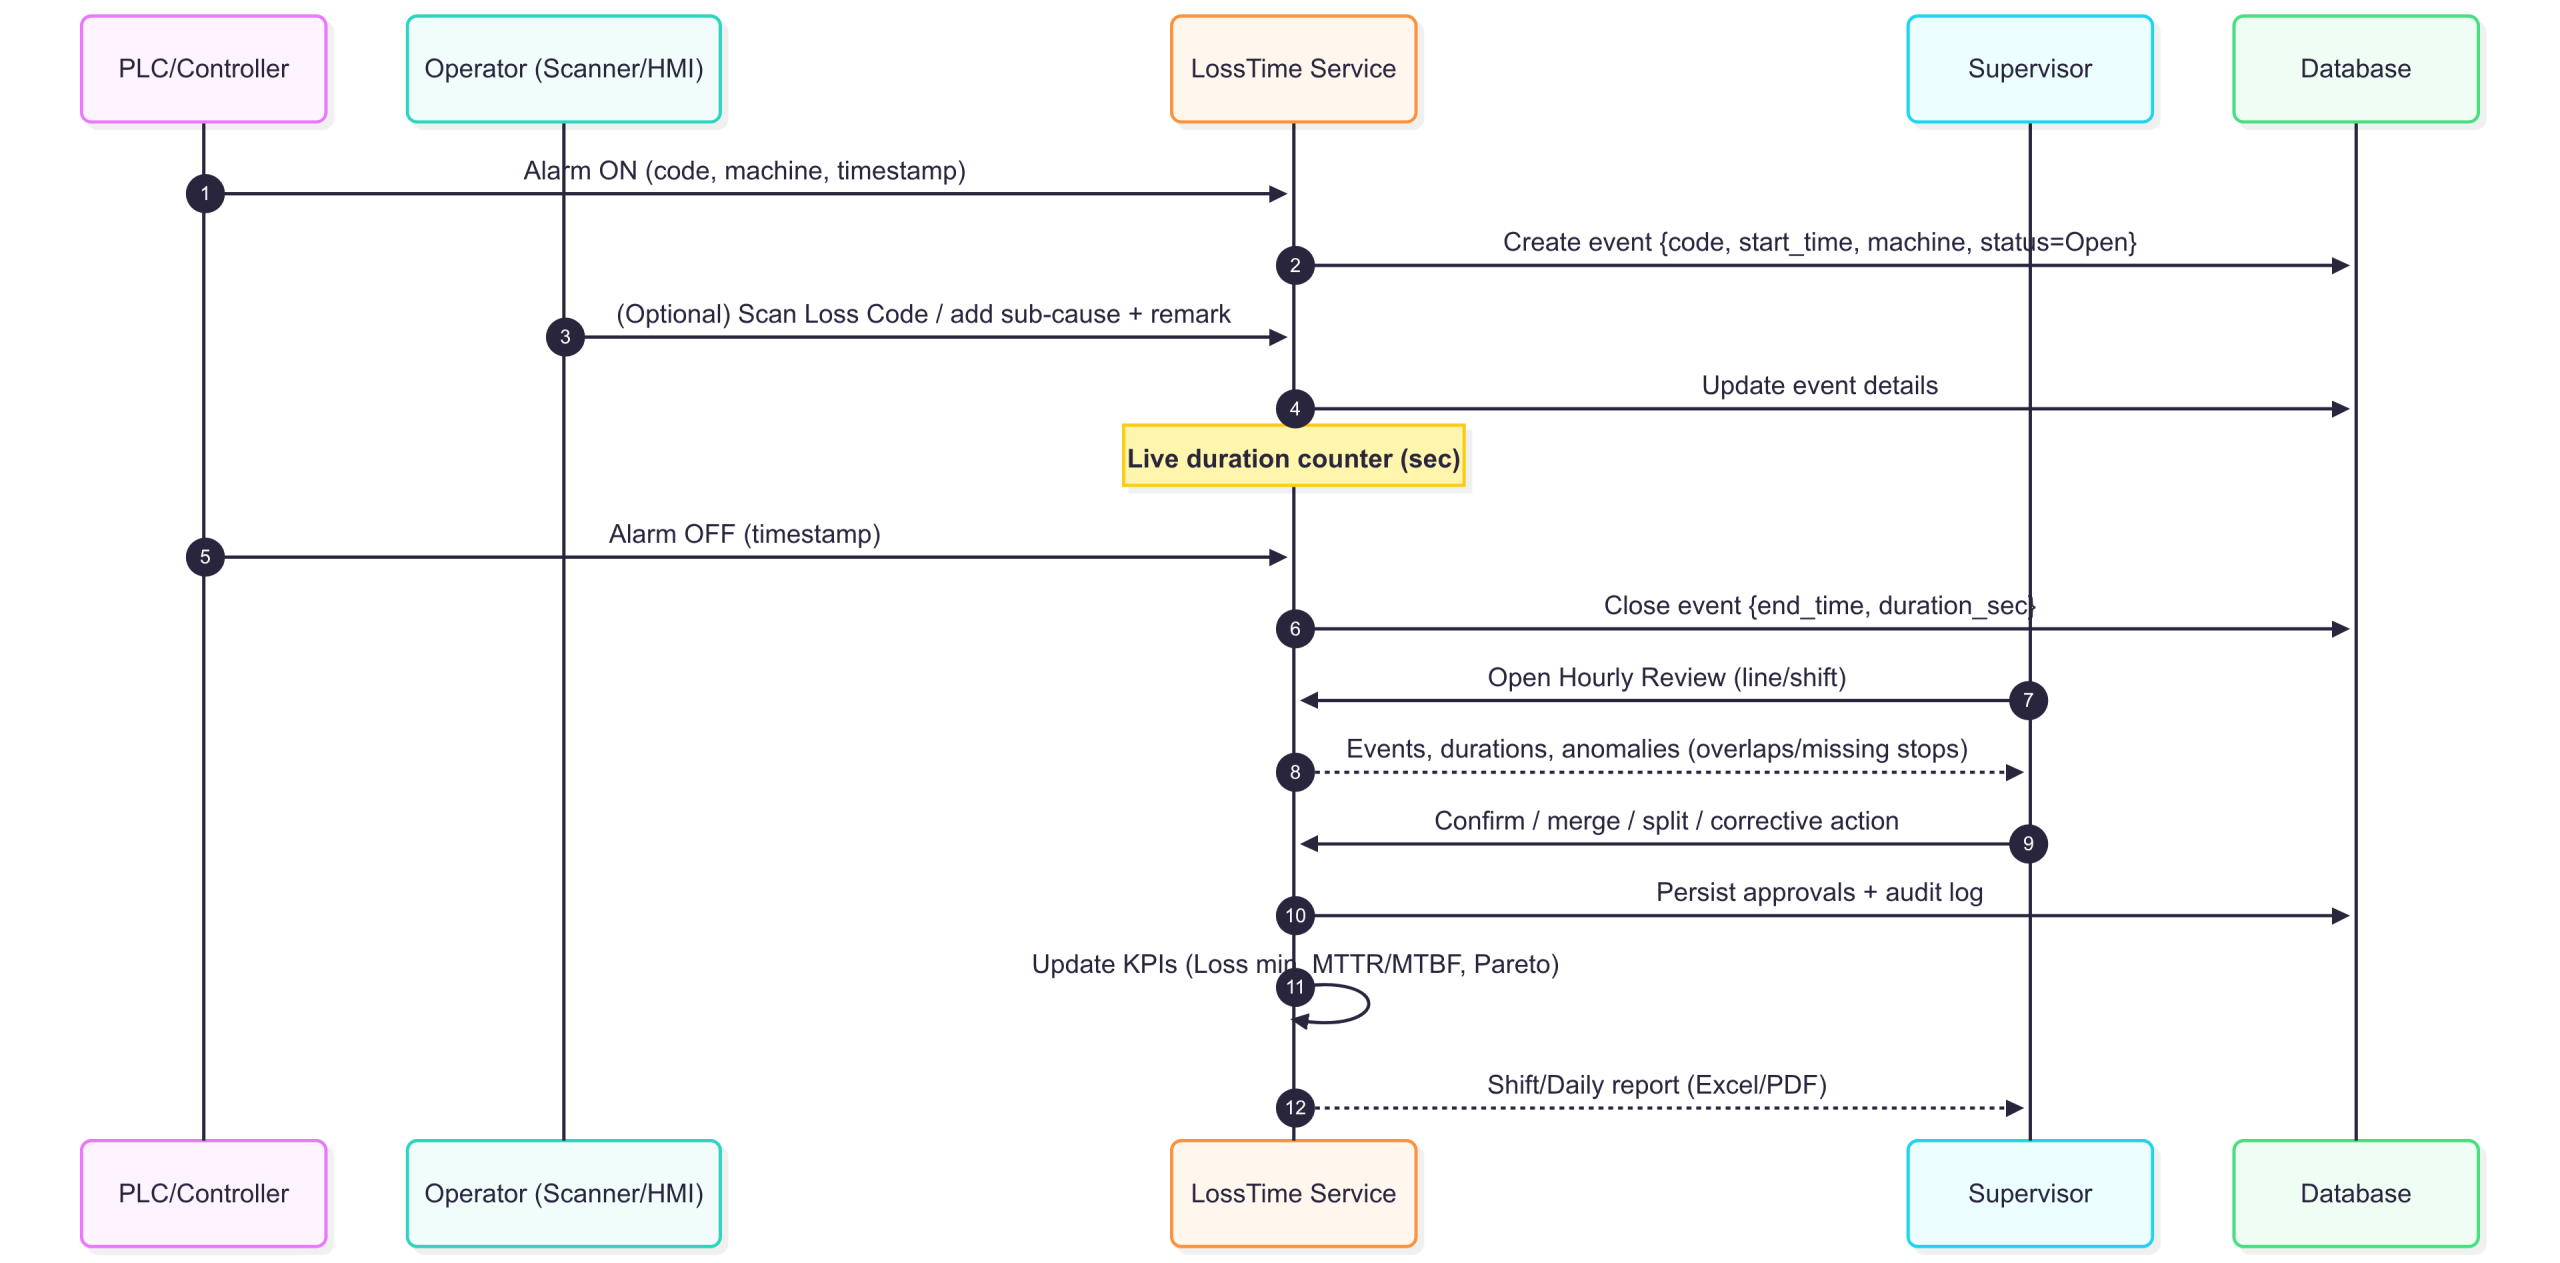
Event Start – PLC alarm triggers OR operator scans a Loss Code → timer starts, timestamp recorded.
Details Entry – Operator adds sub-cause, remark, responsibility, and (optional) attachments.
Event Stop – Auto-stop on alarm reset or manual stop via HMI/scan → duration calculated.
Supervisor Check – Hourly review → confirm/merge/split events; add corrective action.
KPI Calculation – Update Loss Minutes, MTBF/MTTR, OA%, OEE impact; feed Pareto and trends.
Notify & Escalate – If thresholds exceeded, send alert to Teams/email with context link.
Report & Archive – Shift/daily reports stored in database
Use Case: Loss Time Tracking & Analysis System
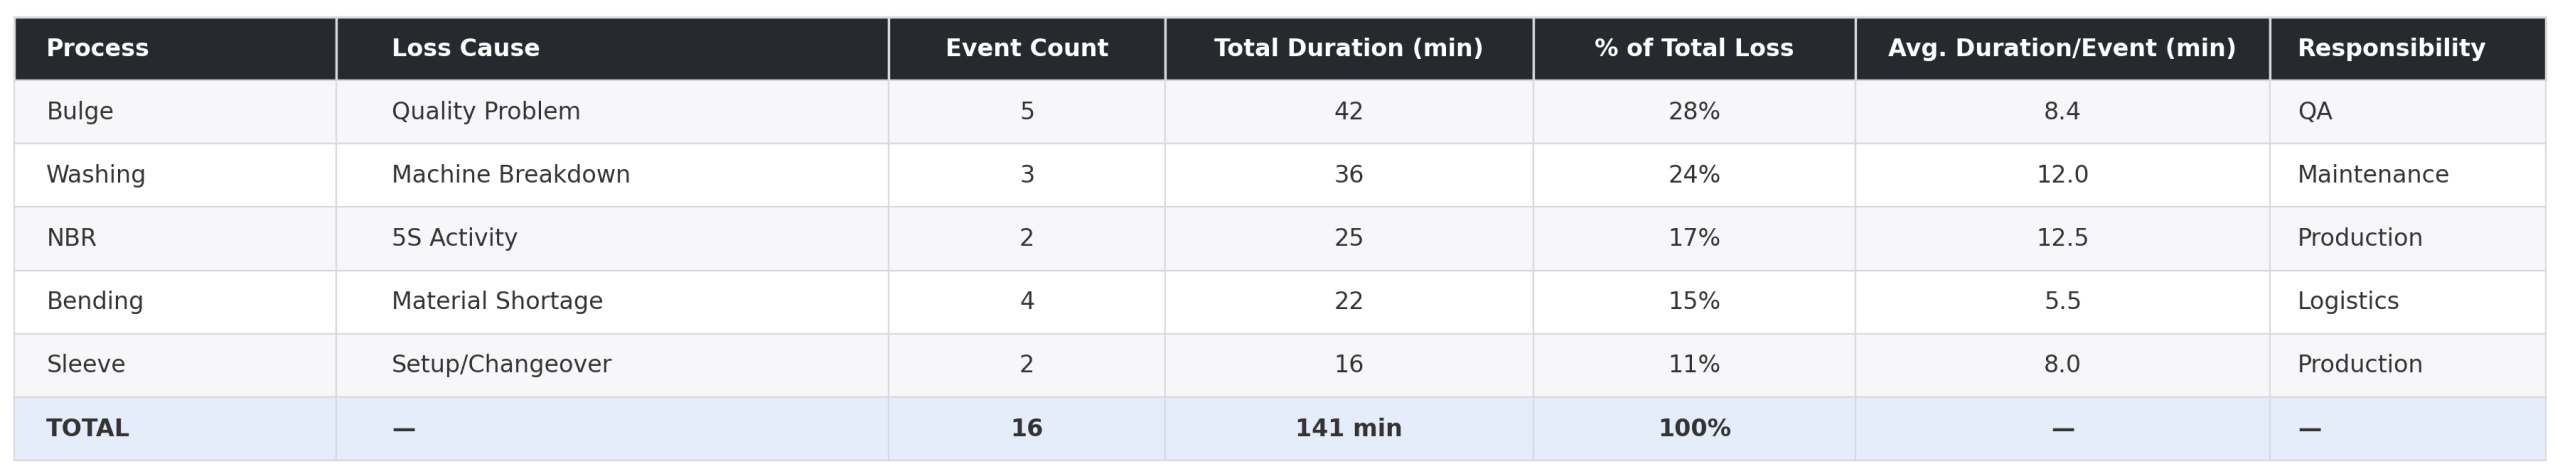
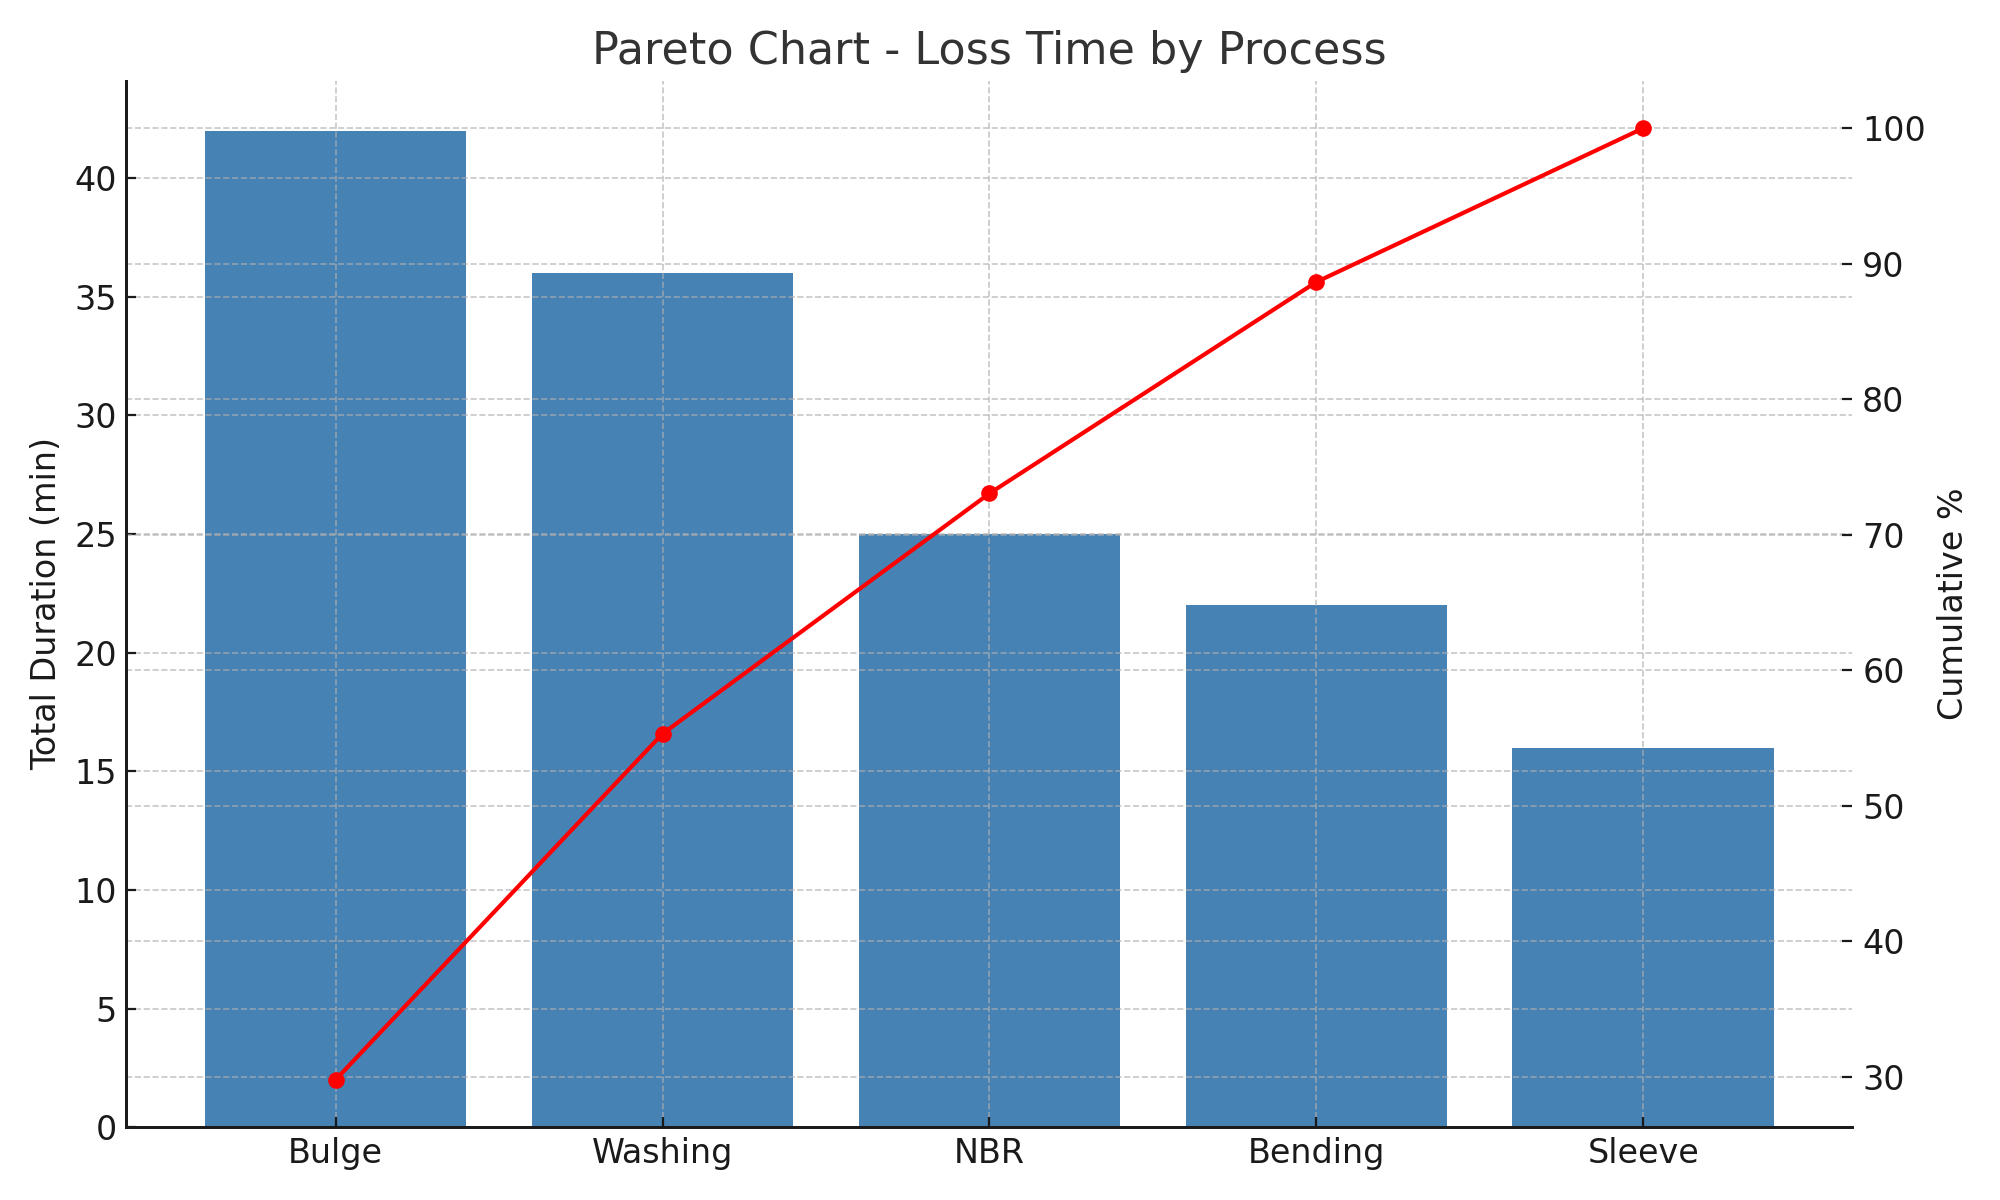
1. Pareto Chart – Loss Time by Process
This chart shows loss duration (minutes) for each process in descending order, with a cumulative percentage line to highlight the major contributors.
- Bulge (42 min, 28%) → The single largest contributor to downtime, caused by Quality Problems.
- Washing (36 min, 24%) → Second highest, caused by Machine Breakdown.
- Together, Bulge + Washing = 66 min (52% of total loss) → meaning over half of the total downtime comes from just 2 processes.
📊 Insight: Focusing on Bulge and Washing could eliminate over 50% of total downtime.
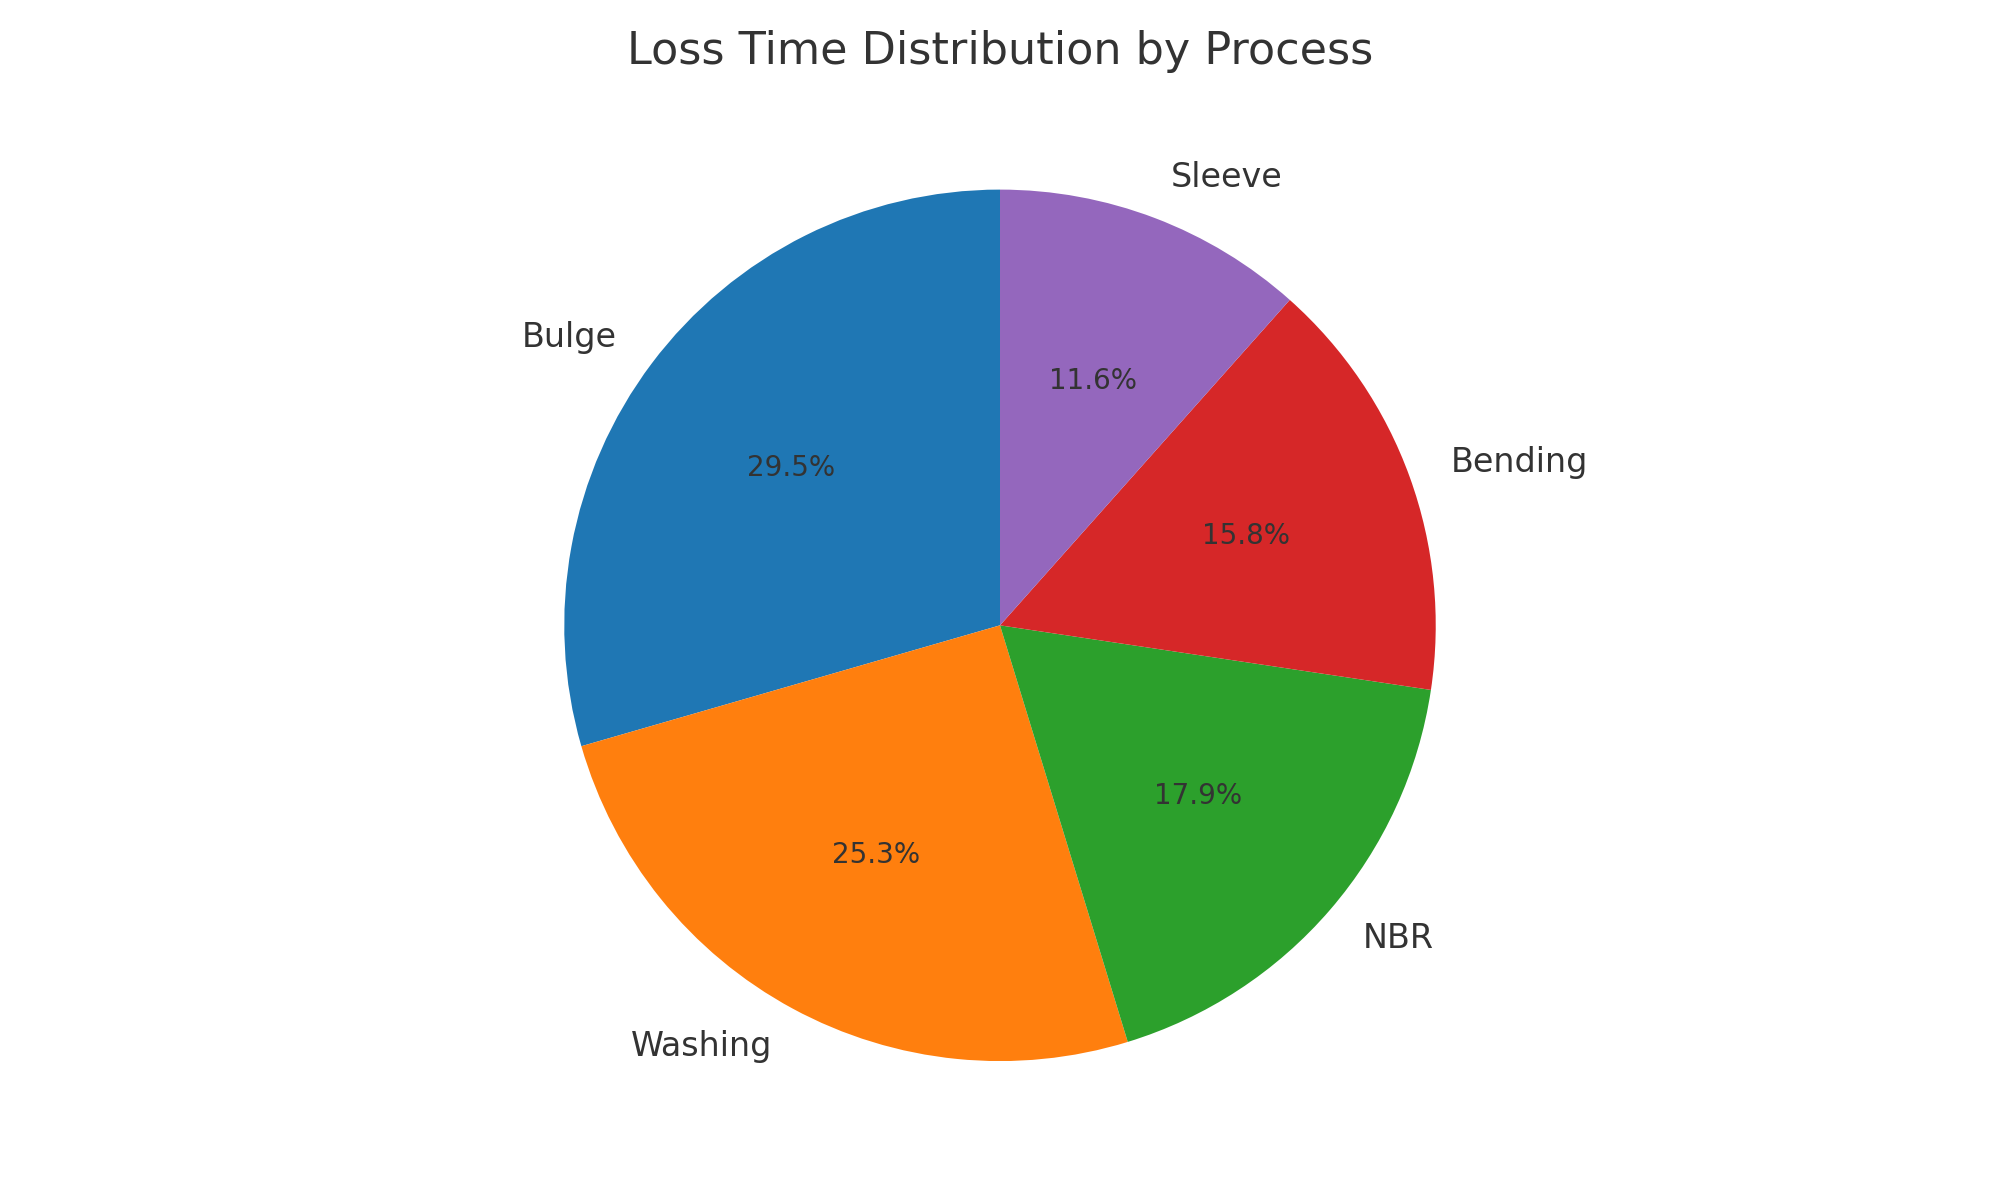
2. Pie Chart – Loss Time Distribution
This chart shows the share of each process in total loss time (141 min).
Bulge = 28%
Washing = 24%
NBR = 17%
Bending = 15%
Sleeve = 11%
📊 Insight: Quality and Machine-related issues dominate, but smaller contributors (NBR, Bending, Sleeve) still represent almost half the downtime combined (43%).
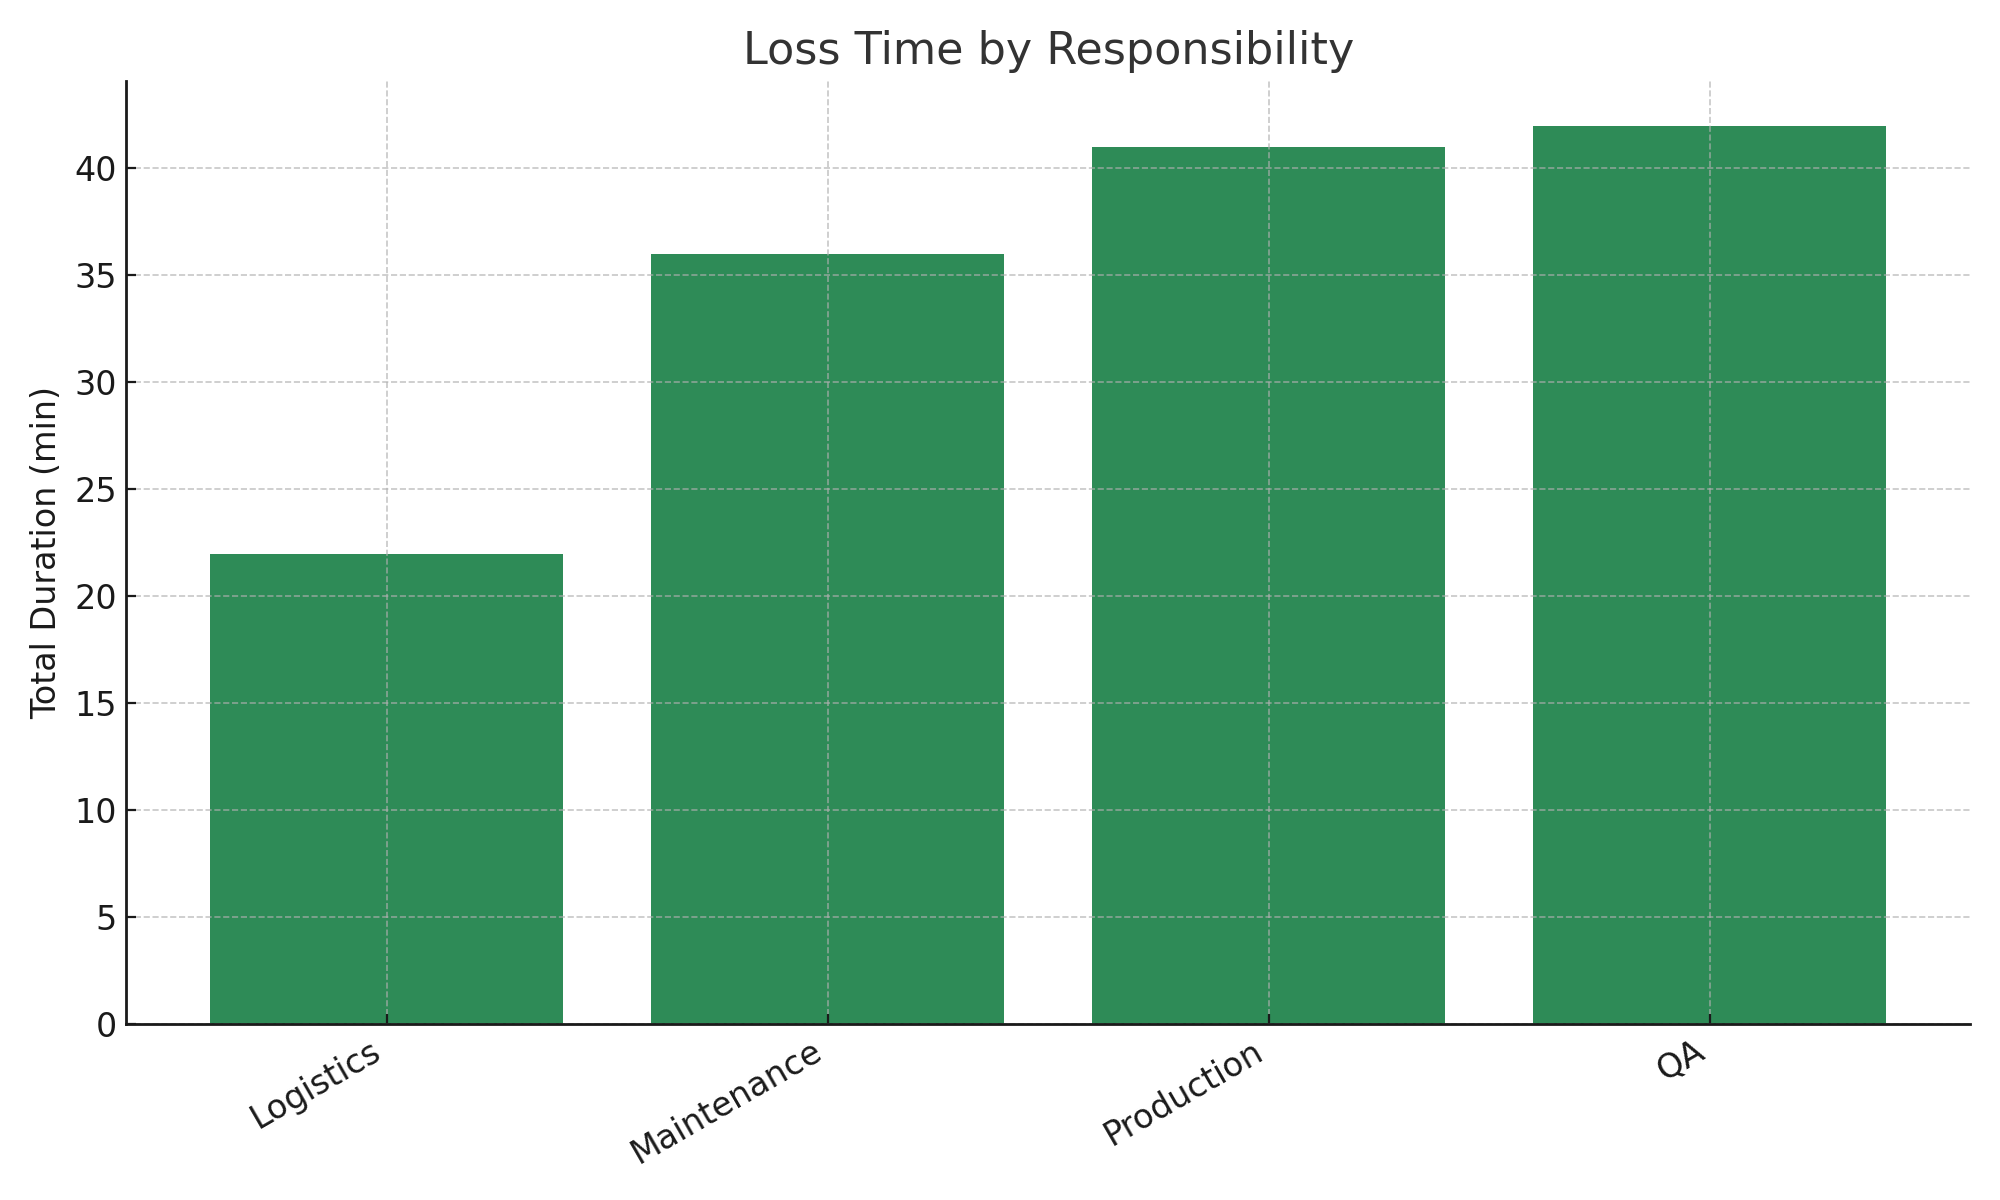
3. Responsibility Bar Chart – Loss Time by Department
This chart groups downtime by responsible department instead of process.
QA = 42 min (28%) → From Bulge Quality Problems.
Maintenance = 36 min (24%) → From Washing Machine Breakdown.
Production = 41 min (29%) → From NBR (5S activity, 25 min) + Sleeve (Setup, 16 min).
Logistics = 22 min (15%) → From Bending Material Shortage.
📊 Insight: Production (29%) and QA (28%) have the biggest shares. Coordinated improvements between QA & Production could yield the fastest gains.