Ensuring Process Stability and Product Quality
Our QA Performance solution delivers advanced
Statistical Process Control (SPC) to monitor and sustain product quality across all production lines.
Real-time process data is continuously collected from inspection stations and benches, stored securely in a centralized SQL database, and visualized through Grafana dashboards.
When control or specification limits are breached, the system automatically sends instant alerts—via Microsoft Teams, email, or any preferred communication platform—complete with detailed analysis and a direct link to the relevant dashboard.
Key Features
Real-Time SPC Monitoring
Continuous data acquisition from inspection stations with live visualization in Grafana, showing control charts, Cp/Cpk, and performance metrics.
Automated Multi-Channel Alerts
Instant notifications via Microsoft Teams, email, or your preferred platform, including detailed breach analysis and direct dashboard access.
Model-Specific Limit Management
Configure and manage LSL/USL (specification limits) and LCL/UCL (control limits) separately for each model, parameter, or production bench.
Traceability & Compliance
Full audit logging of limit changes, alert events, and process history for ISO/IATF compliance and customer audits.
System Workflow
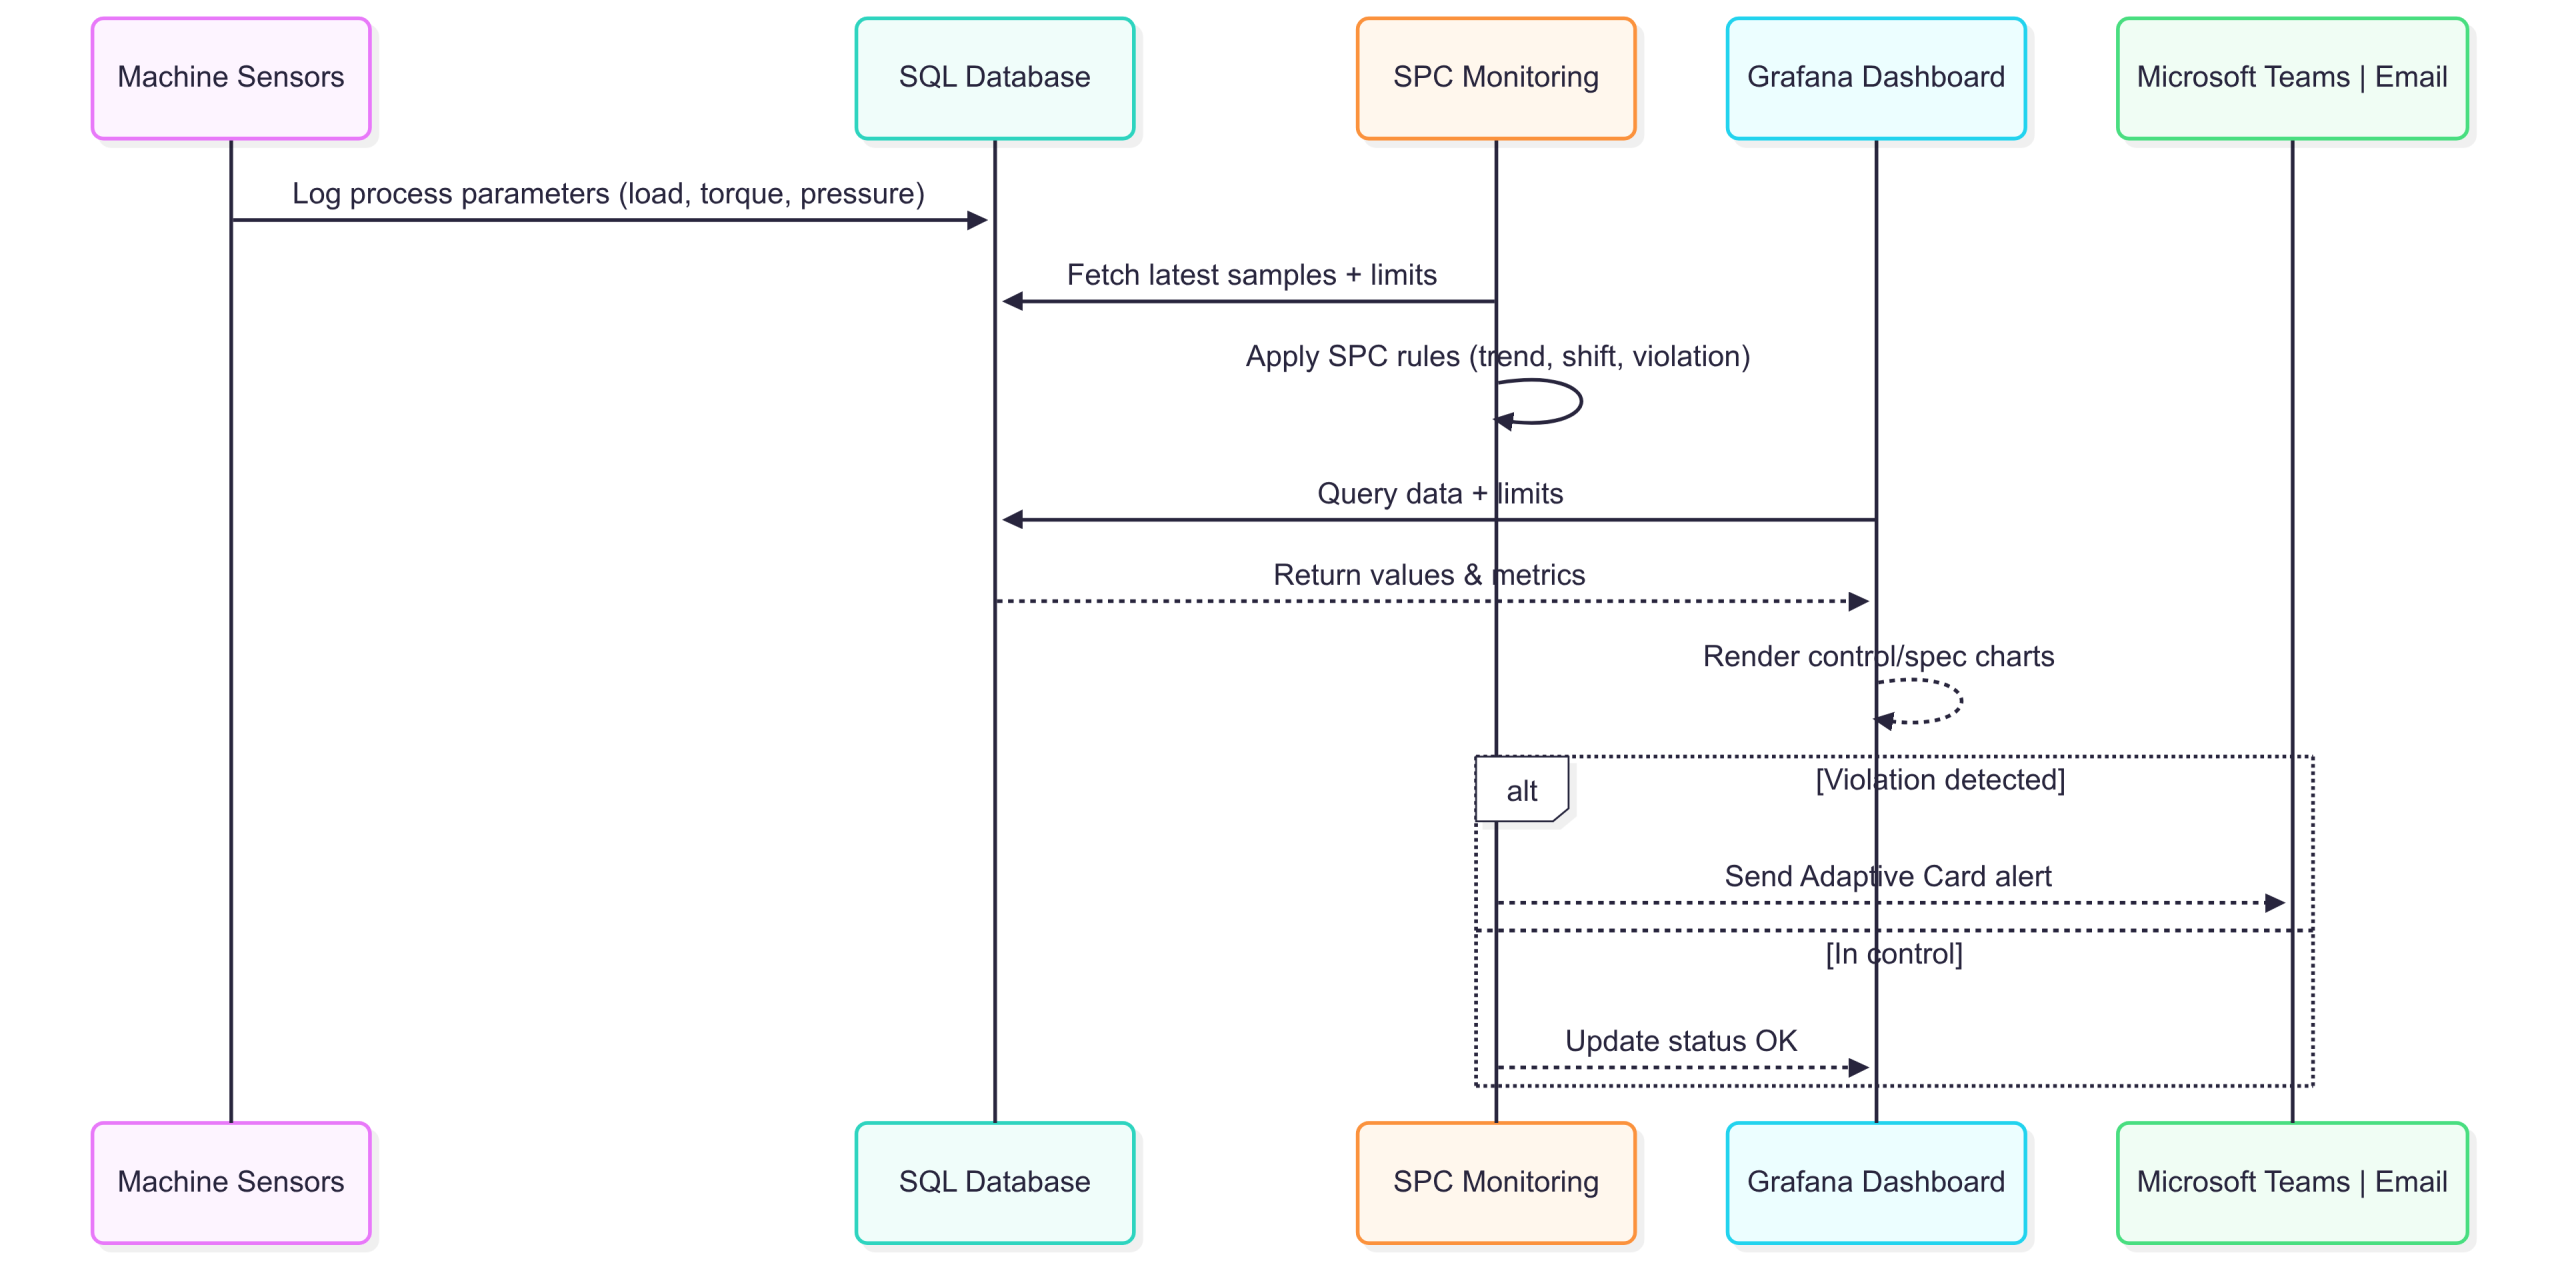
The QA Performance system is an automated quality control loop that continuously captures, analyzes, and reports production data.
Real-time SPC monitoring with instant alerts ensures any deviation from control or specification limits is quickly detected and addressed.
1. Data Acquisition
Process parameters (e.g., solenoid set load, drive motor torque, pressure) are logged continuously to the SQL database.
2. SPC Evaluation
A dedicated monitoring service applies SPC rules to detect trends, shifts, and violations against configured limits.
3. Visualization
Grafana presents dynamic charts with control/spec limits, model-based filtering, and statistical metrics.
4. Automated Notification
Microsoft Teams receives Adaptive Card alerts summarizing the breach, including parameter name, limit values, measured average, sample size, and timestamp range.
Control & Specification Limits Management
Specification Limits (LSL / USL): Derived from product design or customer requirements.
Control Limits (LCL / UCL): Statistically calculated from actual process performance.
Model-Specific Settings: Limits can be applied uniquely for each model, parameter, or production bench.
Version Control: Every limit adjustment is logged with user, date/time, and reason for change.
Microsoft Teams Alerting
Trigger Conditions: Out-of-control, out-of-spec, excessive NG percentage, stacked NG events, or abnormal patterns.
Alert Content: Table name, parameter, average value, limits, sample statistics, time range, and a direct dashboard link.
Technical Specifications
Database: Microsoft SQL Server (with PostgreSQL option available).
Visualization Layer: Grafana with role-based access control.
Monitoring Engine: Python/C# service executing SPC algorithms and managing Teams notifications.
Security: Encrypted data channels, role-based permissions, and full audit logging.